2026-10-22
Build a match.
Get the data.
Choose the formations, the playing styles and the big moments. In seconds you get a full 90 minutes of tracking, events and stats, checked by a built-in validation report. No real players, no data agreements, nothing to install.
Why you will want this
Build before the real data arrives
A new dashboard, model or cleaning script needs data on day one. Generate a full match in seconds, start building today, and swap in your real data when it lands.
Share it with anyone
Nobody real is in this data. Use it in a workshop, a bug report, a job application or a pitch to your club, with no data-sharing agreement and no privacy worry.
Know the right answer
Real data never tells you whether your method is right. Here every effect is planted and written to a truth file, so you can check whether your analysis finds what is really there.
Good for your club
Give analysts, interns and students a full match to practise on, away from the club's real data systems, and rebuild the identical match any time with the same seed.
What you can do with it
- Prototype a dashboardBuild a tracking or event view on a full match before you have any real feed.
- Test your methodPlant a high work-rate player or late-match fatigue, then see whether your analysis finds it.
- Practise cleaningSwitch on sensor noise and dropouts and see whether your code survives messy data.
- Compare set-upsKeep the seed, change a style, and watch how your metrics react. This tests your metrics; it says nothing about real tactics.
- Run a workshopEveryone generates the same match from one seed, so every screen shows the same numbers.
- Stress-test your toolsAdd a red card or a substitution at any minute and see what breaks.
Build your match
You bring the settings, not the data. The match is simulated in your browser, nothing is uploaded, and you download the data it generates. The data is synthetic: it comes from simple stated rules, not from real players or teams, so use it to test code and methods, not to learn about real football.
What you get
| Download | What is in it |
|---|---|
| Player tracking | Time, x and y position in metres (centre spot at 0,0), speed and acceleration, for the players you choose and the ball |
| Match events | Passes, shots, goals, tackles, interceptions, fouls, cards, substitutions, with time, place and outcome |
| Player and team summaries | Distance, high-speed running, sprints, accelerations, passes, shots, xG-style values, possession and more |
| Truth file | Every setting and planted effect, so you can check a method against what you set |
| Validation report | Pass, warning or fail for each check, with the numbers behind it |
The validation report
The checks run on the data you just generated, in four groups:
- Structure: regular time steps, one track per player, missing samples, events in order.
- Physics: players stay on the pitch, speeds and accelerations are within human limits, speed matches position change.
- Consistency: the tracking, the event list and the summary tables agree with each other, for example distance, shot counts and goals.
- Typical ranges: warnings if values are unusual, such as very high distance or pass completion. These ranges are rough guides and unverified.
A pass means these checks found no problem. It does not prove the data is realistic.
How we checked it
Each number below comes from a run we did and saved.
- Tests: 10 automated tests pass, including that the same seed gives the same match, that red cards and substitutions work, and that the validator catches planted faults.
- False alarms: across 30 clean matches, no match had a failed check or a warning.
- Planted faults: we planted four faults in 10 matches each (a player off the pitch, a speed spike, an irregular time step, a block of missing data). The report caught all four every time (10 of 10 each). We wrote those faults ourselves, so this shows the checks work, not that they catch every real-world problem.
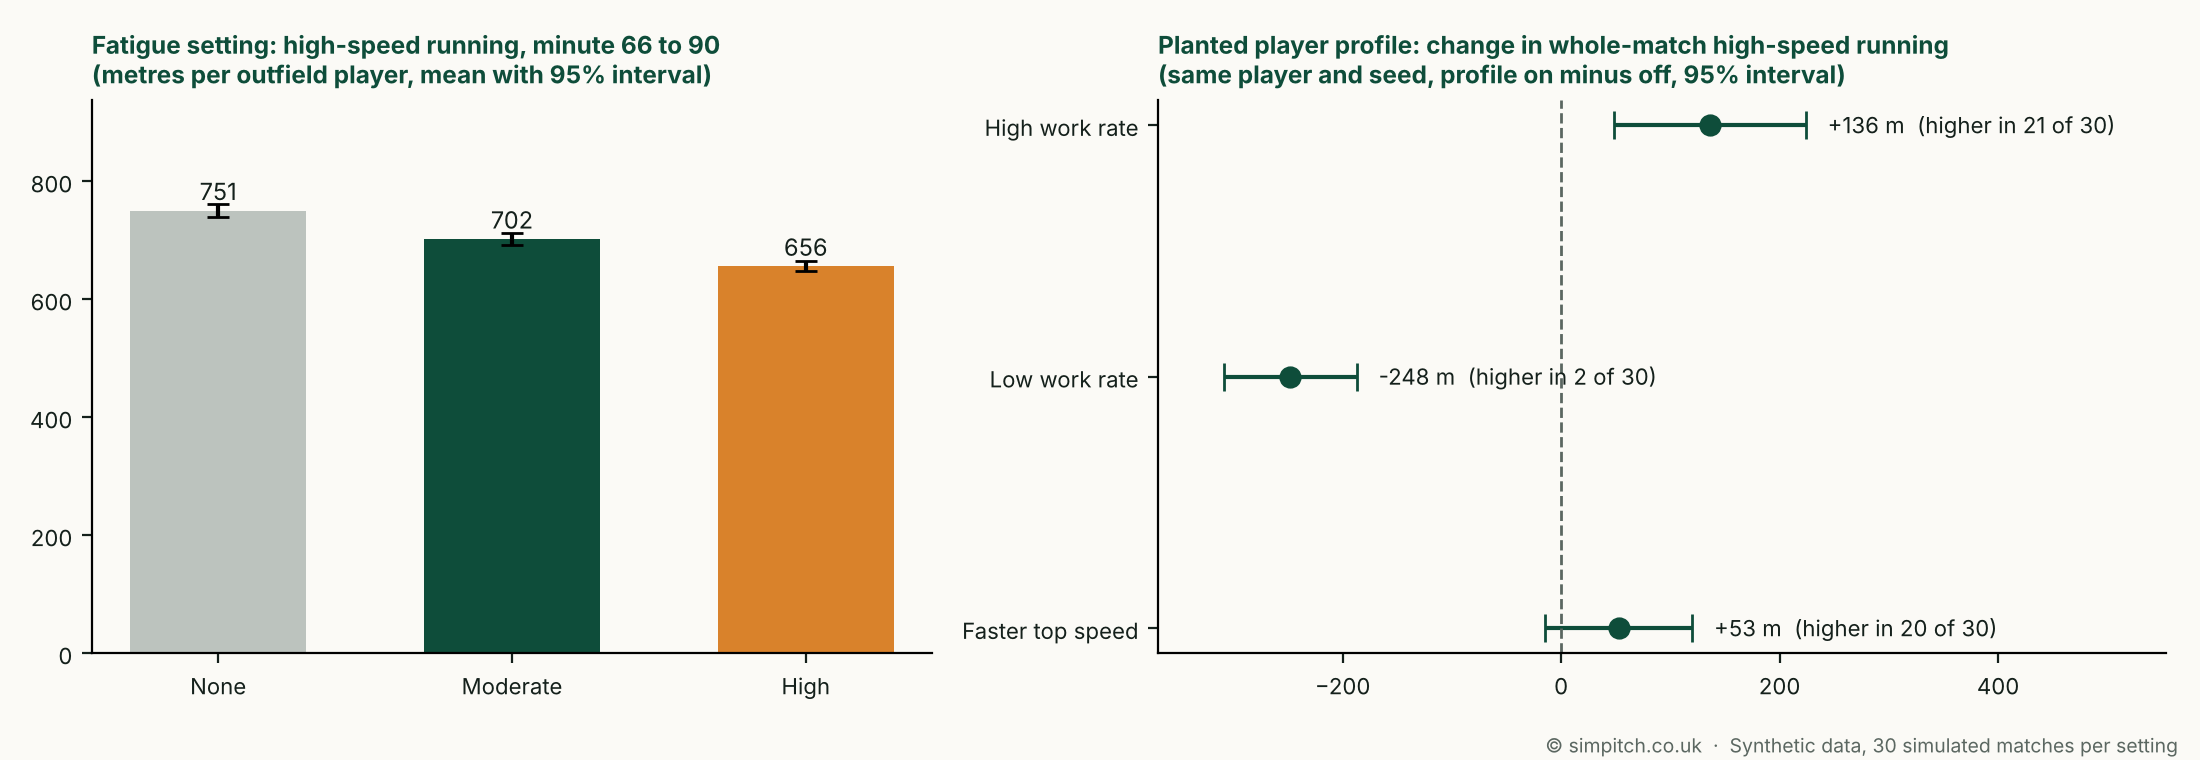
- Planted effects are recovered: over 30 matches, a high work-rate profile raised a player’s high-speed running by 136 m on average (95% interval 48 to 224 m, higher in 21 of 30 matches), and a low work-rate profile lowered it by 248 m (interval 187 to 309 m lower, higher in 2 of 30). A “faster top speed” profile gave +53 m with an interval that includes zero (-15 to 120 m), so with 30 matches it cannot be told apart from no effect.
- Fatigue: late-match (minute 66 to 90) high-speed running per outfield player averaged 751 m with no fatigue, 702 m with moderate and 656 m with high (30 matches each).
Limits
- Synthetic. The match follows simple rules written by us. It does not describe how real teams or players behave, and a model trained on it learns those rules.
- Simplified football. There is no half-time break or change of ends. Corners, throw-ins and offsides are not modelled. The shot model is a simple, hand-set curve, not a real xG model.
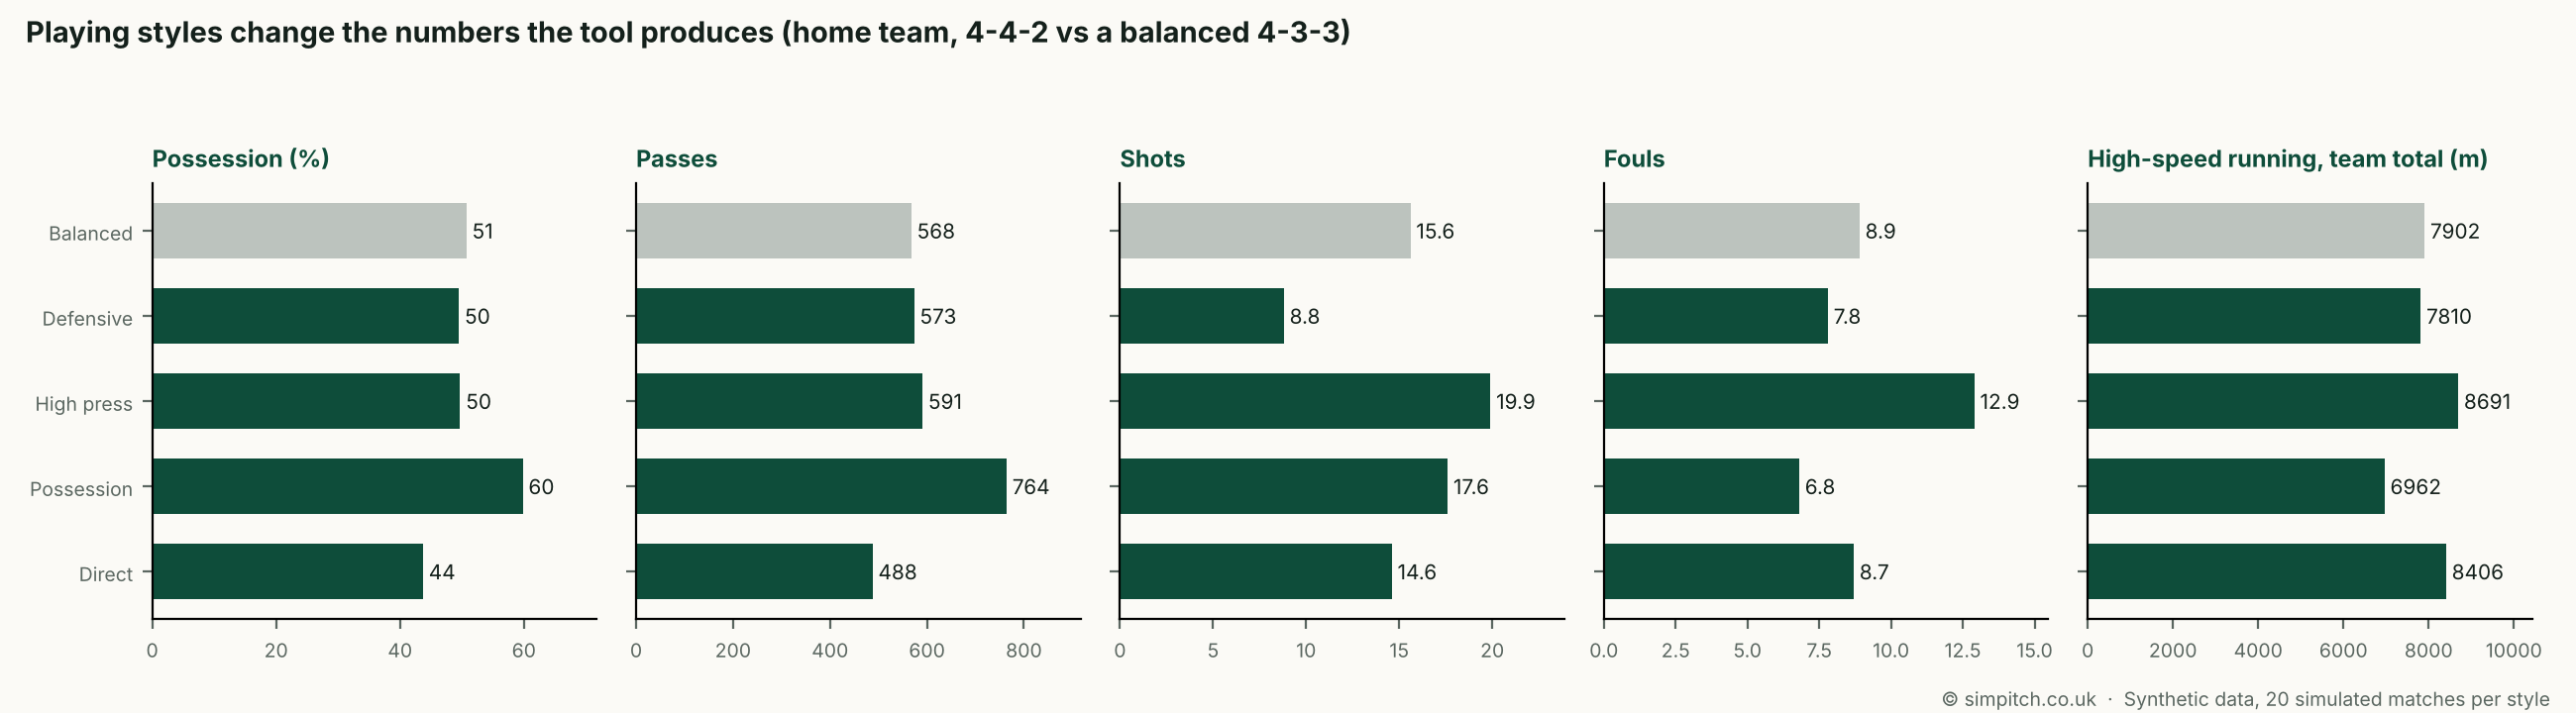
- Styles are not calibrated. They change the numbers in sensible directions, but we did not fit them to real teams. For example, the high press style comes out strongest in these runs; that is a property of the model, not a finding about football.
- Typical ranges are rough and unverified. Thresholds such as 19.8 and 25 km/h are common conventions that clubs and vendors define differently.
- Large files. Tracking everyone at 10 samples per second is about 1.2 million rows; spreadsheets may struggle.
Sources and licences
- No external data and no external libraries are used. The tool is plain JavaScript and runs in your browser.
- High-speed and sprint thresholds (19.8 and 25 km/h) are common conventions, not taken from one source.
- The tool’s code is not offered for download. The data you generate is synthetic and yours to use; please label it as synthetic when you share it.
Cite this article
Marjani, A. (2026). Match data generator. SimPitch. https://simpitch.co.uk/tools/posts/match-data-generator/
Generated data should be labelled as synthetic, with the seed and settings from the truth file.