Player of the Week: Jordan Henderson, two goals from 0.08 xG

Two goals and an assist from three low-quality shots. Gameweek 6’s best performer by our index, and why the numbers say it won’t last.
Player of the week
Chelsea
Gameweek 6
Author

Aryan Marjani

Published

October 12, 2026

2Goals
1Assist
0.08xG from his goals
1 in 614Chance both go in

Jordan Henderson didn’t play a minute in Chelsea’s first four gameweeks. On Saturday, in only his second start, he scored in the first minute, set up Morgan Rogers a minute later, and scored a direct free kick midway through the second half as Chelsea beat Bournemouth 5-1 at Stamford Bridge.

It was the best individual performance of the weekend by our index, and it earned the most Fantasy Premier League points and bonus points of anyone in the gameweek (18 points, 62 BPS). It’s also a strong example of why a scoreline and a performance aren’t the same thing. That’s what this week’s analysis is about.

Data covers the nine Gameweek 6 matches completed by Sunday night. Coventry v Newcastle on Monday is not included.

Jordan Henderson in England's red kit, wearing the captain's armband, during England v Panama at the 2026 World Cup

Henderson captaining England against Panama at the 2026 World Cup, 27 June 2026. Photo: Bryan Berlin, CC BY-SA 4.0, cropped.

How we picked him

Picking a player of the week by goals alone rewards finishing luck. Picking by expected goals alone ignores what actually happened. So we combine four measures for every player who played at least 45 minutes (201 players):

  • Goal involvements: goals plus assists, which is what actually happened.
  • xGI: expected goals plus expected assists (Opta, via the FPL API), which measures the quality of chances taken and created.
  • BPS: the Premier League’s Bonus Points System, which scores dozens of match actions.
  • Defensive contributions: tackles, interceptions, clearances, blocks and recoveries.

Each measure is turned into a z-score (how many standard deviations above the weekend’s average) and the four are averaged with equal weight. Use the buttons to re-rank the top ten by each measure.

Show the code
top = players.head(10).copy()
top["label"] = top["web"] + " (" + top["team"] + ")"
measures = [("index", "SimPitch index"), ("ga", "Goals + assists"), ("xgi", "xGI"),
            ("bps", "BPS"), ("defcon", "Defensive contributions")]

def bars(col):
    d = top.sort_values(col)
    return dict(x=[d[col].round(2).tolist()], y=[d["label"].tolist()],
                marker=[dict(color=[RED if w == "Henderson" else CONTEXT for w in d["web"]],
                             line=dict(color="#FFFFFF", width=2))],
                customdata=[d[["goals", "assists", "xgi", "bps", "defcon", "minutes"]].values.tolist()],
                text=[d[col].round(2).tolist()])

first = bars("index")
fig = go.Figure(go.Bar(
    orientation="h", x=first["x"][0], y=first["y"][0], marker=first["marker"][0],
    customdata=first["customdata"][0], text=first["text"][0], textposition="outside",
    textfont=dict(color=INK), cliponaxis=False,
    hovertemplate="<b>%{y}</b><br>%{customdata[0]} G · %{customdata[1]} A · xGI %{customdata[2]:.2f}"
                  "<br>BPS %{customdata[3]} · Def. contributions %{customdata[4]}"
                  "<br>%{customdata[5]} minutes<extra></extra>"))
fig.update_layout(updatemenus=[dict(
    type="buttons", direction="right", x=0, y=1.13, xanchor="left", showactive=True,
    bgcolor="#F5F7F2", bordercolor="#DCE3DA", font=dict(size=12),
    buttons=[dict(label=name, method="restyle", args=[bars(col)]) for col, name in measures])])
fig.update_xaxes(showgrid=True, gridcolor="#EEF1EC", zeroline=True, zerolinecolor="#C9D1C7")
fig.update_yaxes(showgrid=False)
style(fig, height=470, margin=dict(l=10, r=40, t=60, b=10)).show(config=CONFIG)
Figure 1: Top ten players of Gameweek 6 by the SimPitch index. Hover for each player’s numbers; the buttons re-rank by a single measure.

It’s close. Henderson (2.50) edges Kiernan Dewsbury-Hall (2.33), whose goal and assist for Everton at Hull came with far better underlying numbers: 0.46 xGI and four key passes. Henderson’s teammate João Pedro (2.32) is a hair behind. Switch the chart to xGI and Henderson falls to ninth of these ten. What separates him from everyone else is the gap between what his chances were worth and what he did with them.

Three shots, two goals

Show the code
def half_pitch(fig):
    L = dict(color=LINE, width=2)
    shapes = [
        dict(type="rect", x0=52.5, y0=0, x1=105, y1=68, line=L),
        dict(type="rect", x0=88.5, y0=13.84, x1=105, y1=54.16, line=L),
        dict(type="rect", x0=99.5, y0=24.84, x1=105, y1=43.16, line=L),
        dict(type="line", x0=105, y0=30.34, x1=105, y1=37.66, line=dict(color=INK, width=5)),
        dict(type="path", path="M 52.5 24.85 A 9.15 9.15 0 0 1 52.5 43.15", line=L),
        dict(type="path", path="M 88.5 26.69 A 9.15 9.15 0 0 0 88.5 41.31", line=L),
    ]
    fig.add_trace(go.Scatter(x=[94], y=[34], mode="markers", marker=dict(color=LINE, size=5),
                             hoverinfo="skip", showlegend=False))
    fig.update_layout(shapes=shapes)
    fig.update_xaxes(range=[51.5, 106.5], visible=False, fixedrange=True)
    fig.update_yaxes(range=[-1, 69], visible=False, scaleanchor="x", scaleratio=1, fixedrange=True)
    return fig

c = shots[shots.team == "Chelsea"].copy()
c["px"], c["py"] = c.x * 105, c.y * 68
c["dist"] = np.hypot(105 - c.px, 34 - c.py).round(0).astype(int)
c["goal"] = c.result == "Goal"
c["is_h"] = c.player == "Jordan Henderson"

fig = half_pitch(go.Figure())
for is_h, name in ((False, "Other Chelsea shots"), (True, "Jordan Henderson")):
    for goal in (False, True):
        d = c[(c.is_h == is_h) & (c.goal == goal)]
        if d.empty:
            continue
        col = RED if is_h else CONTEXT
        fig.add_trace(go.Scatter(
            x=d.px, y=d.py, mode="markers", name=name, legendgroup=name,
            showlegend=goal or d.empty,
            marker=dict(size=10 + d.xg * 60, color=col if goal else "rgba(0,0,0,0)",
                        line=dict(color=col, width=2.5),
                        symbol="circle"),
            customdata=d[["player", "minute", "xg", "result", "situation", "dist", "assisted_by"]].fillna("").values,
            hovertemplate="<b>%{customdata[0]}</b>, %{customdata[1]}'<br>%{customdata[3]} · xG %{customdata[2]:.3f}"
                          "<br>%{customdata[4]} · %{customdata[5]} m from goal"
                          "<br>Assist: %{customdata[6]}<extra></extra>"))
for _, r in c[c.is_h & c.goal].iterrows():
    fig.add_annotation(x=r.px, y=r.py, text=f"{r.minute}' · xG {r.xg:.2f}", showarrow=True,
                       arrowhead=0, ax=-70, ay=-34 if r.py > 30 else 34,
                       font=dict(color=INK, size=12), arrowcolor=MUTED, bgcolor="rgba(255,255,255,.85)")
style(fig, height=520, legend=dict(orientation="h", y=-0.02, x=0.5, xanchor="center"))
fig.show(config=CONFIG)
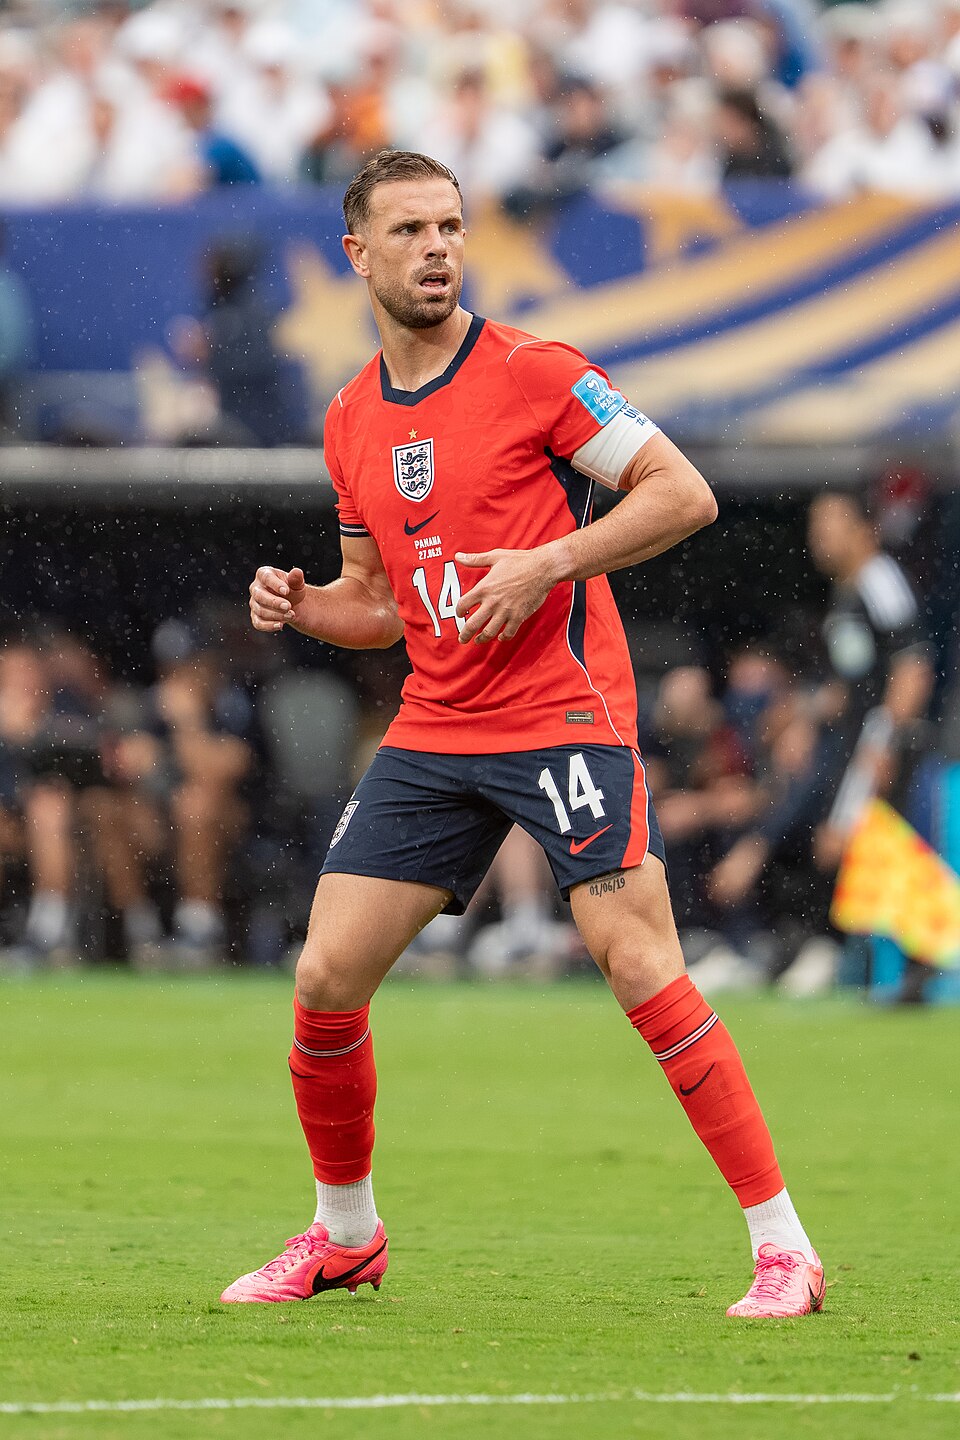
Figure 2: Chelsea’s shots against Bournemouth (Understat). Marker size is xG; filled markers are goals. Henderson’s shots in red.

The first goal came in the opening minute: Henderson finished first time from Cole Palmer’s pass, about 22 metres from goal. Understat values that shot at 0.037 xG, so an average player scores from there roughly 4 times in a hundred. The free kick on 69 minutes, from about 30 metres, was worth 0.044. In all, Henderson’s three shots added up to 0.10 xG, and his two goals to 0.08.

How unlikely was that?

If we treat each shot as an independent coin weighted by its xG, we can work out exactly how often Henderson’s three shots would produce each outcome. Replay the afternoon a million times and here’s what happens:

Show the code
labels = ["0 goals", "1 goal", "2 goals", "3 goals"]
fig = go.Figure(go.Bar(
    x=labels, y=dist * 100,
    marker=dict(color=[CONTEXT, CONTEXT, RED, CONTEXT], line=dict(color="#FFFFFF", width=2)),
    text=[f"{v*100:.2f}%" if v >= 0.0001 else "<0.01%" for v in dist], textposition="outside",
    cliponaxis=False, textfont=dict(color=INK),
    hovertemplate="%{x}: %{y:.3f}% of replays<br>about 1 in %{customdata:,.0f}<extra></extra>",
    customdata=[1 / v if v > 0 else float("nan") for v in dist]))
fig.update_yaxes(title="Share of replays (%)", gridcolor="#EEF1EC", rangemode="tozero")
fig.update_xaxes(showgrid=False)
style(fig, height=400).show(config=CONFIG)
Figure 3: Probability of each outcome from Henderson’s three shots, treating each as independent with its Understat xG.

About 90% of the time those three shots produce nothing. Two or more goals happens about 0.34% of the time, and the exact pair he scored about 1 in 614. Shots aren’t really independent coin flips (a good striker of the ball is better than the average player the model is built on), but even generously, this was a once-in-a-career kind of day.

The game was closer than 5-1

Show the code
fig = go.Figure()
for team, col in (("Chelsea", RED), ("Bournemouth", CONTEXT)):
    d = shots[shots.team == team].sort_values("minute")
    mins = [0] + d.minute.tolist() + [95]
    cum = [0] + d.xg.cumsum().tolist()
    cum = cum + [cum[-1]]
    fig.add_trace(go.Scatter(x=mins, y=cum, mode="lines", line=dict(color=col, width=2.5, shape="hv"),
                             name=team, hovertemplate=team + ": %{y:.2f} xG by %{x}'<extra></extra>"))
    g = d.assign(cum=d.xg.cumsum())[d.result == "Goal"]
    fig.add_trace(go.Scatter(x=g.minute, y=g.cum, mode="markers", showlegend=False,
                             marker=dict(color=col, size=11, line=dict(color="#FFFFFF", width=2)),
                             customdata=g[["player", "xg"]].values,
                             hovertemplate="⚽ %{customdata[0]}, %{x}'<br>shot xG %{customdata[1]:.2f}<extra></extra>"))
    fig.add_annotation(x=95, y=cum[-1], text=f"<b>{team}</b> {cum[-1]:.2f}", xanchor="left", showarrow=False,
                       font=dict(color=INK))
fig.update_xaxes(title="Minute", range=[0, 112], dtick=15, gridcolor="#EEF1EC")
fig.update_yaxes(title="Cumulative xG", gridcolor="#EEF1EC", rangemode="tozero")
style(fig, height=420, showlegend=False, hovermode="x unified").show(config=CONFIG)
Figure 4: Cumulative xG through the match (Understat). Markers show goals; hover for the scorer.

Bournemouth created more: 1.68 xG to Chelsea’s 1.38, and Rayan had the best chance of the first half (0.29 xG, saved). Chelsea scored five times from chances worth fewer than one and a half goals. Henderson’s two goals (+1.92 above their xG) account for about half of that overperformance. Rogers’ early strike (0.06 xG) and João Pedro’s goal just before half-time (0.11 xG) were also low-percentage finishes.

Where this fits in his career

Show the code
cr = career[career.minutes > 0].copy()
cr = pd.concat([cr, pd.DataFrame([dict(season="2026/27", minutes=season.minutes.sum(),
                                       goals=season.goals.sum(), assists=season.assists.sum())])])
fig = go.Figure(go.Bar(
    x=cr.season, y=cr.goals,
    marker=dict(color=[RED if s == "2026/27" else CONTEXT for s in cr.season], line=dict(color="#FFFFFF", width=2)),
    customdata=cr[["minutes", "assists"]].values,
    hovertemplate="<b>%{x}</b><br>%{y} goals · %{customdata[1]} assists<br>%{customdata[0]:,} minutes<extra></extra>"))
fig.add_annotation(x="2026/27", y=2, text="180 minutes so far", yshift=14, showarrow=False,
                   font=dict(color=INK, size=12))
fig.update_yaxes(title="Goals", gridcolor="#EEF1EC", dtick=1)
fig.update_xaxes(showgrid=False, tickangle=-45)
style(fig, height=380).show(config=CONFIG)
Figure 5: Jordan Henderson’s Premier League goals by season (FPL API). He played abroad in 2023/24 and 2024/25.

Henderson has never been a goalscorer: 34 Premier League goals across 16 seasons, and only one in 1,911 minutes for Brentford last season. Two in 180 minutes this season is already more than his previous two Premier League seasons combined.

What to expect next

  • The goals won’t continue at this rate. Over his Premier League career Henderson has scored roughly once every 1,000 minutes. Two goals from 0.08 xG is finishing variance, not a new skill.
  • The underlying contribution is real. Eight defensive contributions, two key passes and a 0.53 xG build-up value (Understat’s measure of a player’s involvement in moves that end in a shot, excluding the shot and assist) show a midfielder doing the job he’s in the side for.
  • His place is the question. He didn’t play in the first four gameweeks. If he keeps starting when Chelsea go to Everton on Saturday, that tells us more about his season than this scoreline does.

Sources: Fantasy Premier League API (Opta-derived match statistics, xG, BPS and defensive contributions) and Understat (shot locations and xG). Note that Understat’s and Opta’s xG models give different values for the same shots. Data retrieved 12 October 2026. Photo by Bryan Berlin via Wikimedia Commons (England v Panama, 27 June 2026), CC BY-SA 4.0, cropped.